News Story
FlashMeeting Analysis Tool Released
Peter Scott, Wednesday 17 Jan 2007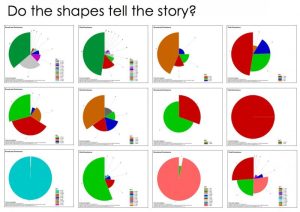
Today we have finally released the visualization tools that we have been using to try to understand the structure of virtual events in our FlashMeeting work. Currently these tools are only available for meetings that have been syndicated as free for public reuse; but we will be releasing a version for private events presently. We hope to encourage event participants to make their events public (and give them to the world) so that they too can examine their structure!
FlashMeeting Polar Area dominance charts now accompany the detailed linear event vizualizations that have been part of FlashMeeting minutes since Version 2. Polar area charts were first used by Florence Nightingale in the Crimea to powerfully illustrate the causes of death of the soldiery. She wanted to show in the most compelling way possible, that the real enemies in the Crimean war were Cholera and Typhus.
We want to show who has been doing what in any given virtual event. SO the FlashMeeting broadcast dominance chart is a form of ‘polar area diagram’ in which the circle of the chart is divided according to each user’s percentage of the total broadcast time of all participants. It excludes any ‘silences’ in the event, only counting the time in which users are choosing to take a turn to speak. So, in an hour long event, if the combined broadcasts of all users totalled 50 minutes of that hour, then a participant who broadcast for 25 minutes would have half the chart circumference i.e. a segment of 180 degrees. In addition, the radius of each user’s segment indicates the relative proportion of the number of broadcasts that the user made compared to the others.
This means that we can define the broadcast dominance of a participant by the area of each chart segment, being a product of the proportion of the audio-visual time of the meeting by the number of audio-visual ‘turns’ taken.
The accompanying chat dominance chart is a similar polar area diagram whose circle is divided according to each user’s percentage of the total chat message character count. So, for example, if 1000 text-chat characters were typed by all event participants, a user typing 500 of these characters would be represented by a segement with an angle of 180 degrees, or half of the total chart circumference. I
This means that we can define the chat dominance of a participant by the area of each chart segment, being a product of the proportion of the ‘text typed’ by the number of chat ‘turns’ taken.
It should be noted that our polar area visualizations are quite different to those of Florence Nightingale as the ordering of segments for us is a product of the analysis rather than an independent variable. Our dominance segments are ordered by area counter-clockwise from the top. The first segment has the largest area and the last segment has the least visible area. Because of this ordering of the segments, our charts have a tendency to an “ammonite” shape, which would not have been found in the original Nightingale concept.
In our published work, we are using the power of these visualizations to explore the structure of events and the roles taken by each participants.
Related Links:
Connected


Latest News
Three KMi researchers were recognised as top scientists in Computer Science at the OU
KMi’s Generative AI mini-Scotland Tour
AI for the Research Ecosystem workshop #AI4RE
KMi congratulates Dr. Joseph Kwarteng for successfully defending his doctoral thesis